Analysing a List Using Counts and Crosstabs
Connect Toolkit
The Counts and Crosstabs tool can perform data analysis in a number of ways. You can analyse your current list or every voter that you have access to.
The tool creates a simple table of numbers that you can then export for further analysis in Microsoft Excel, or a similar program.
There are two ways to access the tool:
1. Going in via my list will mean that counts and crosstabs defaults to look at just the voters in your list
2. Entering via report manager sets up counts and crosstabs to look at all the voters you have access to
But you can switch between analysing your list and all of your voters while using the tool by changing the 'From' drop down menu between the My List and All Voters options
NOTE: Your analysis is performed in real-time for lists below 50,000 people. If you are working with a larger list the data displayed will have been compiled overnight, so won't include anything entered today. You will also be restricted to a smaller number of data fields - for example you won't be able to pick out an individual question to look at.
Accessing Counts and Crosstabs via My List:
1. Start from the My List page in either My Voters or My Campaign.
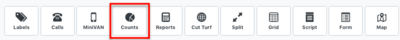
2. Click on the Counts icon from the icon bar at the top of the screen.

3. Select Run Quick Counts and Crosstabs and click the Next button.
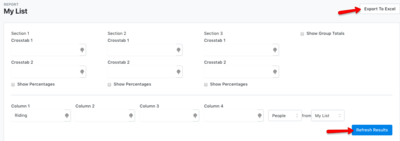
4. You are now on the Counts and Crosstabs page for My List.
5. Click on the drop-down on Crosstab 1
6. Click on the (+) sign next to the option you need to compare. For example, in Master Question you can click No Cycle then Master Party ID. Alternatively, select the latest Canvass Analysis (under the Data Fields heading) or look at marked register data under Vote History, or look at one of the Target Pools
7. Next you need to choose how you would like this data broken down. Click on the drop-down for Column 1.
8. Click on the (+) sign next to Data Field. Here you can choose Polling District, Ward, Constituency etc. Click Ward.
7. Click the Refresh button. Your analysis will be displayed in the bottom table.
8. To export the results to excel click on the Export to Excel button.
9. If you want you can change the People drop down menu to show you Households or Phones (be aware that this can lead to double counting as some multi-member households will appear in more than one column).
10. You can also tick a box to get percentages as well as raw numbers. This is where analysing your list rather than all voters is helpful. The percentage of Lib Dem voters found might be a very small percentage of all voters, but a large percentage of your current list, depending on how it is defined.
11. Try selecting Polling District in Column 2 and clicking refresh. Now you can see the data broken down further by both ward and polling district. If you want to see the ward totals as well, then tick the Show Group Totals box in the top right and click Refresh.
Accessing Counts and Crosstabs via Report Manager
1. Start from the Main Menu of your My Voters or My Campaign tab.
2. Click on Report Manager in the Reporting & Data Analysis box from the Main Menu.
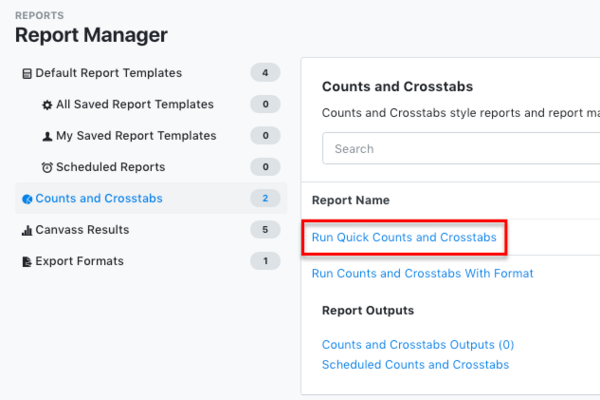
3. Click on Counts and Crosstabs from the side menu of the Report Manager page.
4. Click on Run Quick Counts and Crosstabs under Report name.
5. You are now on the Counts and Crosstabs page for “All People” (on the My Voters side).
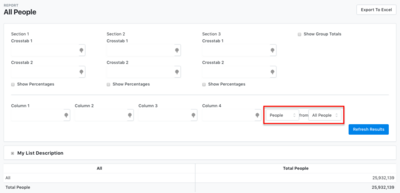
5. Proceed as above.
Example: Analysing your canvass data by polling district using Counts and Crosstabs
Counts and Crosstabs can be a useful tool to see your campaign’s progress. A great way of keeping track of your campaign’s efforts is to analyse a list of voters identified by canvassing. This allows you to see where you have been most active and where you are getting the best response in order to target your campaign accordingly.
Creating a list to report on Voter IDs
1. Begin on the My Voters side of Connect
2. Go to the Create a List tool
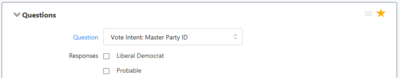
3. Go to Questions and select Vote Intent: Master Party ID (among the questions at the very bottom of the list with no year in their name) to create a list of anyone that has been canvassed (you can add a date range if you just want to look at recent data)
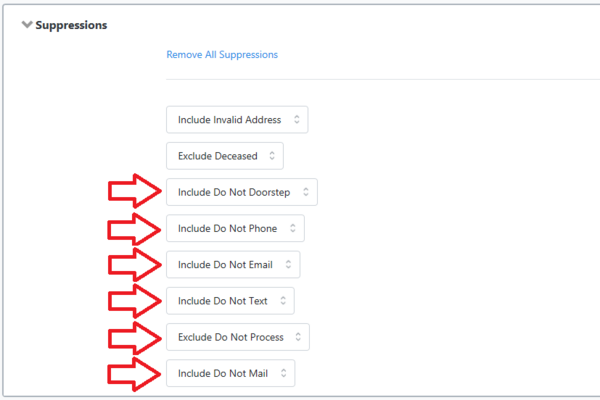
4. Go to Suppressions and Include Do Not Doorstep, Phone, Email, Text and Mail by clicking Remove All Suppressions
5. Click on Run Search in the green button.
6. On the My List page, click on the Counts icon from the icon bar at the top of the screen.
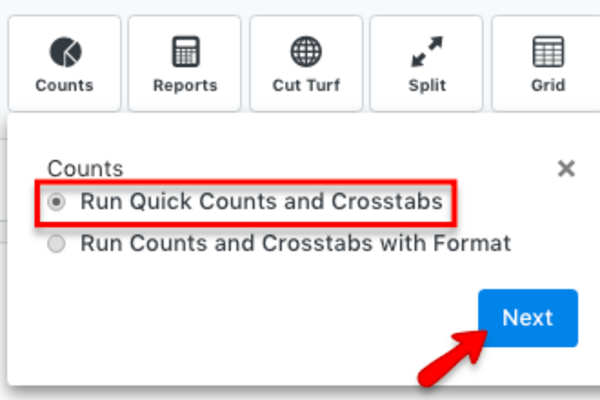
7. Select Run Quick Counts and Crosstabs and click the Next button.
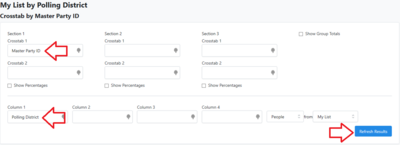
8. You are now on the Counts and Crosstabs page. Click on the drop-down for Column 1. Click on the (+) sign next to Data Field. Click Polling District.
Click on the drop-down menu for Section 1 – Crosstab 1. Click on the (+) sign next to Master Question. Click No Cycle. Click Vote Intent. Click Master Party ID. Then hit Refresh Results.
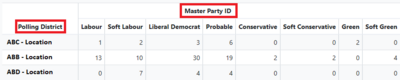
9. You now have your list of voter IDs analysed by polling district. Try displaying the ward name as well as the polling district, using both columns 1 and 2. Try also ticking the Show Percentages box and the Show Group Totals box.
10. Now try going back to your search and adding a second step to include those who refused to answer any questions (you can find the Refused option under the Contact Status tab of Create a List - remember to choose the same date range as for the earlier step). Now return to Counts and Crosstabs. You can now get a better idea of what percentage of your contacts are saying they will support us.